Advanced MLB Betting Strategies: How Sharps Beat the Books

The gap between recreational bettors and professionals isn’t luck or bankroll size — it’s methodology. While casual bettors chase hot streaks, bet their favorite teams, and trust gut feelings over data, sharp bettors treat baseball as a market with exploitable inefficiencies. They hunt for value systematically, manage bankrolls ruthlessly, and view each wager as a small piece of a much larger puzzle.
This distinction matters because MLB betting specifically rewards the sharp approach. With 2,430 regular-season games producing massive sample sizes, the variance that protects bad strategies in football eventually exposes them in baseball. Over 162 games per team, edges compound while mistakes accumulate. The bettors who survive and profit approach baseball with the discipline of traders rather than the hope of gamblers.
Understanding what separates successful MLB bettors from the rest reveals a pattern: they’ve developed systematic advantages in specific markets rather than trying to beat every game. Some crush totals betting by modeling weather and ballpark effects. Others dominate first five innings markets through superior starting pitcher analysis. The common thread is specialization backed by rigorous process.
The strategies outlined in this guide require work. You’ll need to track data, build models (even simple ones), and maintain records detailed enough to reveal your actual edges. If that sounds tedious, consider that sportsbooks employ teams of analysts doing exactly this work to set their lines. Competing against them casually is a recipe for donating your bankroll over time.
Table of Contents
- What Separates Sharps From Recreational Bettors
- Top-Down Versus Bottom-Up Handicapping
- Using Sabermetrics for Betting Edges
- Identifying Market Inefficiencies
- Totals Versus Sides: Where Is the Edge?
- Exploiting Early Lines and Steam Moves
- Underdog Betting Strategies
- The First Five Innings Edge
- Bankroll Management for Volume Bettors
- Building Your Edge
What Separates Sharps From Recreational Bettors

Sharp bettors approach MLB with a fundamentally different mindset than casual players. The recreational bettor wants entertainment — a rooting interest, a reason to watch the game, maybe a story to tell friends about a winning parlay. Nothing wrong with that, but it’s not the path to consistent profit.
Professional bettors view each game through the lens of expected value. Does this line offer positive expected value based on their projections? If yes, they bet it regardless of whether it’s an exciting matchup or involves their least favorite team. If no, they pass — even on games they planned to watch anyway. This emotional detachment feels unnatural at first but becomes second nature with practice.
The betting patterns reveal the distinction clearly. Recreational bettors favor favorites, parlays, and prime-time games that receive heavy media coverage. Sharp action flows toward underdogs, totals, and early-week games that fly under the radar. The reasoning is straightforward: less scrutinized markets contain more inefficiencies, and plus-money positions on underdogs require lower win rates to profit.
Bankroll management marks another clear divide. Recreational bettors size bets based on confidence — big on “sure things,” small on longshots — which invites disaster when those sure things lose. Sharps use consistent unit sizing, typically risking 1-3% of their bankroll per play, knowing that variance will even out over sufficient volume. This approach survives losing streaks that would wipe out confidence-based sizing.
Record keeping distinguishes serious bettors from everyone else. Sharps track every wager with details including closing line, odds shopped across multiple books, reasoning for the play, and eventual outcome. This data reveals genuine edges over time. Without it, you’re guessing whether your strategy works while memory bias tells you comfortable lies about your winning percentage.
Top-Down Versus Bottom-Up Handicapping
Two fundamental approaches to MLB handicapping divide the betting community, and most successful bettors lean heavily toward one or blend both deliberately. Understanding these frameworks helps you develop a sustainable process rather than just picking games randomly.
Top-down handicapping starts with the betting line itself. You assume the market has already incorporated most available information, then look for specific factors the line might be overlooking or overweighting. This approach acknowledges that oddsmakers are good at their jobs and focuses on finding edges at the margins rather than trying to price games from scratch.
A top-down bettor might notice that a team’s moneyline seems too cheap given the starting pitcher matchup, then investigate why. Perhaps the public is overreacting to a recent losing streak, or the line hasn’t fully adjusted to a late lineup change. The edge comes from identifying what the market missed rather than building your own complete projection.
Bottom-up handicapping takes the opposite approach — building game projections from first principles using your own models. This method requires more work but potentially uncovers larger edges. You gather data on both teams’ underlying performance metrics, project expected runs scored and allowed, convert those projections to win probability, then compare against the market.
Sophisticated bottom-up models incorporate factors including starting pitcher quality (using metrics like FIP and xFIP rather than ERA), bullpen strength weighted by expected usage, offensive performance against similar pitcher types, and ballpark adjustments. Building such models takes significant time, but they provide a consistent framework that removes emotional decision-making from the equation.
Most working bettors combine both approaches. They use bottom-up models to identify games where their projections differ significantly from market prices, then apply top-down reasoning to explain the discrepancy. If the explanation makes sense (the market is slow to react to recent information), they bet. If not (their model is probably missing something), they pass.
Using Sabermetrics for Betting Edges
Sabermetrics — the empirical analysis of baseball statistics — has transformed both how teams evaluate players and how sharp bettors handicap games. The basic insight is that traditional stats like ERA and batting average contain too much noise to reliably predict future performance. Advanced metrics attempt to isolate the factors players actually control.
FIP (Fielding Independent Pitching) ranks among the most useful betting metrics. Unlike ERA, which includes balls put in play that depend heavily on defensive skill and luck, FIP focuses only on outcomes the pitcher controls directly: strikeouts, walks, hit batters, and home runs. A pitcher with a high ERA but low FIP likely got unlucky on balls in play and should perform better going forward.
The next evolution, xFIP, adjusts FIP by normalizing home run rates to league average. Some pitchers allow more fly balls than others, but the percentage of fly balls that become home runs is largely random. A pitcher who gave up excessive home runs but has a normal fly ball rate will likely see his xFIP regress toward his true talent level.
For hitters, wOBA (weighted on-base average) provides a more complete picture than batting average or even OBP. It weights each offensive outcome by its actual run value — a home run is worth more than a single, a walk less than a double. When projecting team offense against specific pitchers, wOBA against similar pitcher types offers better predictive value than overall batting average.
wRC+ (weighted runs created plus) takes wOBA a step further by adjusting for ballpark effects and expressing everything relative to league average (100 is average, 110 means 10% better than average). This normalization helps compare hitters across different environments and eras.
Applying these metrics to betting requires comparing teams’ underlying performance to their actual results. A team that’s been losing close games but has strong underlying metrics (good FIP from starters, high wRC+ from hitters) is probably due for positive regression. The market often lags in recognizing these situations, creating value on “unlucky” teams.
Pitcher-specific sabermetrics become crucial for totals betting. A matchup between two pitchers with excellent FIPs but high ERAs suggests the market might overestimate expected runs. Conversely, two pitchers who’ve been getting lucky (low ERA, high FIP) face regression that could push the scoring higher than the line implies.
The key is understanding what these metrics measure and what they don’t. FIP tells you about outcomes pitchers control, but it doesn’t account for pitch quality, sequencing, or ability to limit hard contact. SIERA and other newer metrics attempt to address these gaps. The more you understand the limitations, the better you can apply these tools appropriately.
Identifying Market Inefficiencies
Markets become inefficient when available information isn’t fully reflected in the price. In MLB betting, these inefficiencies appear predictably in certain situations, and recognizing them provides edges that compound over a full season.
Public bias creates the most consistent inefficiency. Casual bettors favor big-market teams, recent winners, and popular players, inflating odds on their opponents. The Yankees playing a Tuesday afternoon game in Kansas City sees more action on New York than the matchup warrants, pushing the Royals’ moneyline to plus-money territory that offers positive expected value. Fading the public isn’t a guaranteed winning strategy, but it’s a useful starting point for identifying potential value.
Weather and schedule spot adjustments lag behind actual impact. When forecasts show 15 mph wind blowing out at Wrigley, the market eventually adjusts totals upward — but not immediately. Bettors who monitor weather conditions and act before line movement capture value that disappears once the market catches up. Similarly, teams playing their fourth game in four cities face fatigue the market underprices.
Lineup information creates temporary inefficiencies. When a team announces a star hitter is sitting, the line adjusts — but how quickly and how much varies by sportsbook. Alert bettors who monitor lineup news can sometimes grab stale lines before updates propagate across all books. This edge requires infrastructure (lineup alerts, multiple accounts) but rewards those who build it.
Bullpen usage tracking offers another edge. When a team’s best relievers pitched multiple innings the previous two nights, their effectiveness drops significantly on short rest. The market somewhat accounts for this, but rarely fully. Tracking high-leverage reliever usage across the league helps identify situations where bullpen quality differs from what casual observers assume.
The late scratch inefficiency appears when pitchers are pulled at the last minute. Sportsbooks may pull games entirely or offer adjusted lines, but the new lines often overreact or underreact to the replacement pitcher’s quality. Having quick access to minor league stats and recent reliever performance helps evaluate these situations before the market finds equilibrium.
Playoff and late-season dynamics create unique inefficiencies. Teams playing out the string in September mail in performances against motivated playoff-chasing opponents, but the market doesn’t always fully discount these situations. Conversely, teams locked into playoff spots may rest regulars in ways that aren’t immediately obvious from starting lineups.
Totals Versus Sides: Where Is the Edge?
A perpetual debate among sharp bettors concerns whether totals (over/under) or sides (moneyline/run line) offer more profitable opportunities. The honest answer is that both markets can be beaten, but they require different skill sets and offer different profiles of edge.
Totals markets tend to be softer for several reasons. Setting accurate game totals requires synthesizing more variables than sides — both pitchers, both offenses, bullpen depth, weather, ballpark effects, and umpire tendencies all matter. Oddsmakers face a more complex modeling challenge, and complexity breeds inefficiency. Additionally, recreational bettors focus heavily on picking winners, leaving totals markets less efficiently priced by heavy public action.
The argument for sides focuses on information edges. Starting pitcher changes, lineup shuffles, and injury news all affect which team wins more directly than total runs scored. If you have superior sources for real-time information or faster processing of public information, sides offer more opportunities to exploit temporary mispricings before the market adjusts.
Sharp bettors who specialize in totals often cite the reduced impact of luck over the course of a game. A late error that lets the go-ahead run score crushes your moneyline bet but barely affects your over bet if the game was already high-scoring. This smoothing of variance helps totals specialists achieve steadier results across larger sample sizes.
Volume bettors face a practical consideration: sides see more action and higher limits at most sportsbooks. If you’re trying to move meaningful money, you can get more down on sides before getting limited. Totals betting at scale requires shopping across multiple books and accepting that limit issues will constrain your effective bankroll.
The optimal approach probably involves both markets, selected based on where your specific handicapping identifies value. Don’t force sides bets when your edge lives in totals, and vice versa. Track your results separately by market to understand where your process actually generates profit.
Exploiting Early Lines and Steam Moves
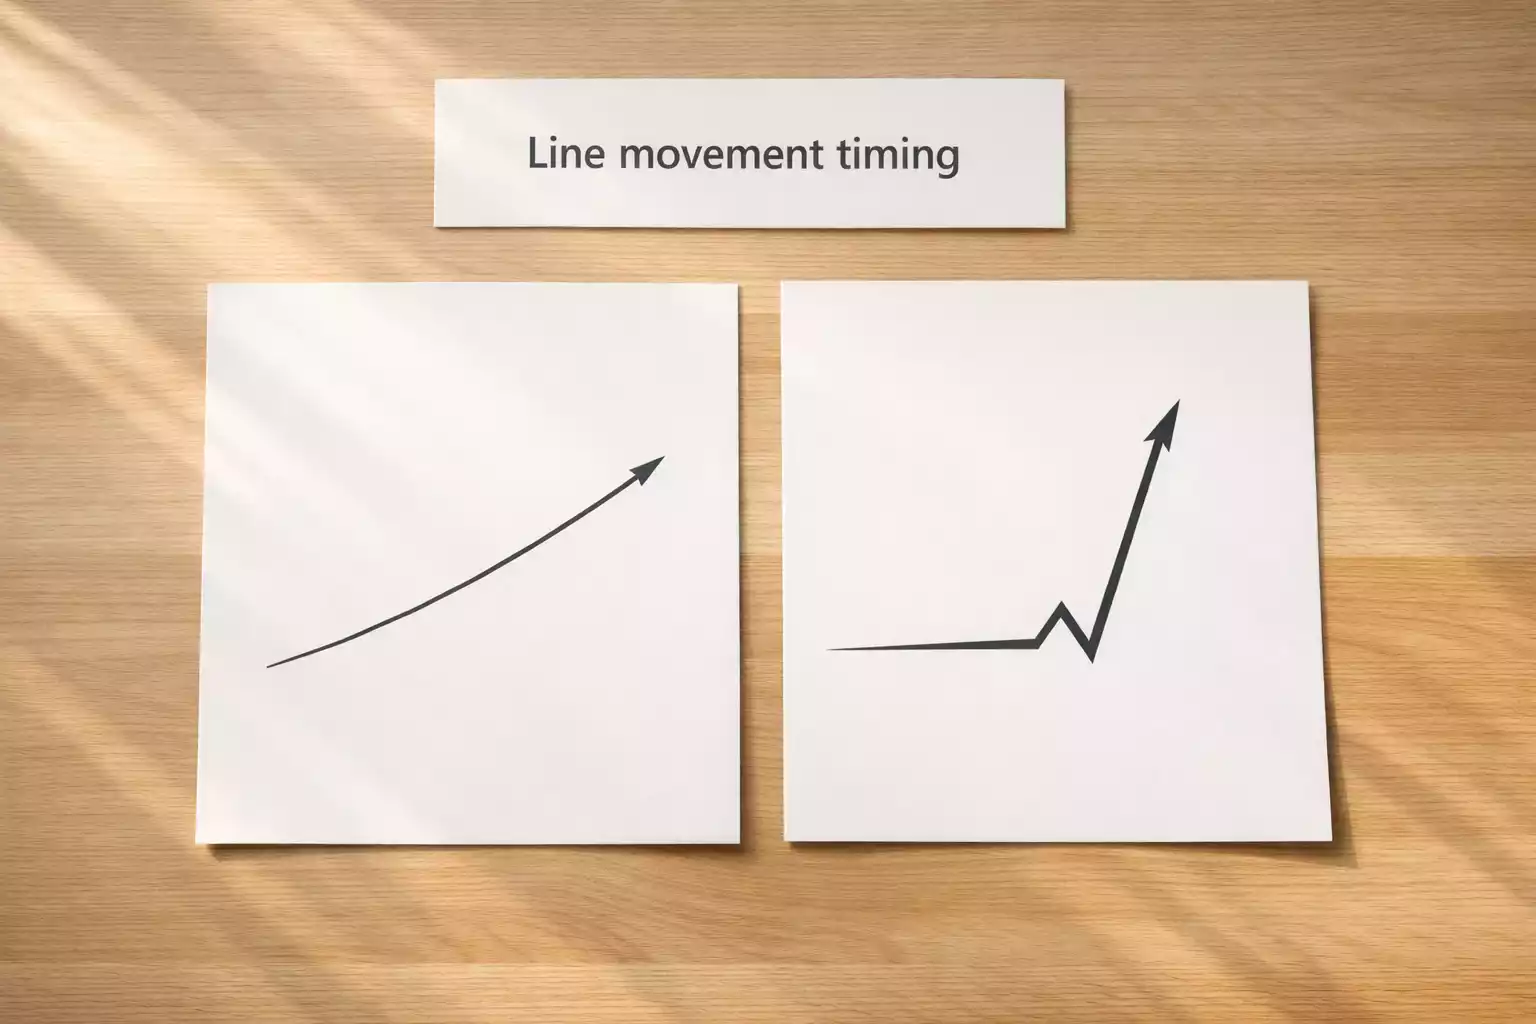
Line movement tells a story about where smart money is flowing. Understanding how to read these moves — and when to act on them — provides edges that compound across thousands of bets over a career.
Early lines, sometimes called “overnight” or “opening” lines, appear before the betting public gets involved. These initial numbers reflect the sportsbook’s own projections without significant market input. Sharp bettors who can handicap games quickly target early lines to grab numbers before they move toward efficient pricing.
The advantage of betting early lines diminishes if you’re slower than the market. If sharps have already hit the early line and pushed it three cents by the time you look, you’re not getting early-line value — you’re following steam. Understanding whether you’re ahead of or behind market moves matters tremendously for timing strategy.
Steam moves occur when coordinated sharp action hits multiple sportsbooks simultaneously, causing rapid line movement across the market. These moves often signal informed money on one side. However, blindly following steam without understanding the reasoning is a losing strategy. Sharps have access to information and models you don’t; by the time you see the line move, the value is often already gone.
Reverse line movement offers potentially stronger signals. When the public heavily backs one side but the line moves the opposite direction, it suggests sharp money on the less popular side outweighs recreational volume. A team taking 70% of public bets should see its line shorten, so if the line lengthens instead, the sportsbook is clearly more worried about sharp action on the other side.
Closing line value (CLV) provides the ultimate arbiter of betting skill. If you consistently bet sides that close at shorter prices than when you bet them, you’re finding value regardless of short-term results. Tracking CLV over large samples tells you more about your edge than simple win-loss records, which are subject to variance over shorter periods.
Underdog Betting Strategies

Underdogs in baseball win at historically high rates compared to other sports — roughly 44% of the time across recent seasons. This base rate means that finding value on plus-money positions doesn’t require projecting upsets; it requires identifying lines that don’t properly reflect realistic win probabilities.
The math of underdog betting works in your favor. At +150, you only need to win 40% of your bets to profit. At +200, just 33.3% wins break even. Compare this to favorites at -200, where you need 66.7% winners to break even. The margin for error is simply larger when betting plus money, which protects against inevitable projection errors.
Certain situations produce underdog value consistently. Teams facing aces who are due for regression (high ERA, low FIP) get overpriced by a market that still relies on traditional stats. Road underdogs in divisional matchups face opponents who may be overlooking them after recent success. Early-season underdogs benefit from market overreaction to small sample performances.
Sharp underdog bettors focus on the number rather than the team. If your projection says a team wins 42% of the time, you bet them at +150 or better regardless of whether you like the team or find the matchup interesting. This detachment from outcome preference is difficult psychologically but essential for disciplined execution.
The variance in underdog betting requires bankroll preparation. You’ll experience longer losing streaks than favorite bettors even with identical edge. A profitable underdog approach might produce eight losses followed by four wins; the math works but the experience feels brutal. Flat unit sizing and mental preparation for cold streaks separate successful underdog bettors from those who abandon ship prematurely.
The First Five Innings Edge
First five innings (F5) betting isolates starting pitchers and removes bullpen variance from your handicapping. This market attracts sharp action because pitcher analysis — the most predictable element of baseball — determines the outcome directly.
The edge in F5 markets comes from games where your starting pitcher projections diverge from market expectations. If you believe a pitcher’s ERA overstates his talent (high BABIP, low FIP), the F5 line might not fully reflect his underlying quality. The market prices full-game lines more efficiently because more action flows there; F5 lines sometimes lag behind.
Pushes occur frequently in F5 markets when games are tied after five innings. This affects expected value calculations slightly, reducing variance compared to full-game betting. Some bettors prefer this feature; others find it annoying when their winning position becomes a push due to extra-inning scoring.
Bankroll Management for Volume Bettors

Volume betting in MLB requires disciplined bankroll management more than any other sport. With 15 games most days and multiple bet types per game, the temptation to overextend bankrupts undisciplined bettors quickly.
The standard recommendation of 1-3% per play assumes you’re betting a handful of games daily. High-volume MLB bettors sometimes reduce to 0.5-1% per play to accommodate larger portfolios. The goal is having enough bets across a season that your edge materializes through variance rather than being wiped out by an unlucky week.
Flat betting beats confidence-based sizing for most bettors. The research consistently shows that bettors overestimate their ability to identify “strong” versus “weak” plays. Betting the same amount regardless of perceived confidence smooths results and prevents catastrophic losses on “sure things” that lose.
Separate tracking by bet type, league (home/away), and time of season reveals where your actual edge lives. Maybe you crush totals but bleed on run lines. Perhaps your first-half results outperform your second-half numbers. This data guides refinement of your approach over time.
Building Your Edge
The tools for serious MLB handicapping are largely free or low-cost. FanGraphs provides comprehensive sabermetric data including FIP, xFIP, wOBA, and park factors. Baseball Savant offers Statcast data on exit velocity, launch angle, and expected statistics. Weather tracking services help with totals analysis.
Combining these resources with disciplined record-keeping creates the foundation for sustainable profit. The bettors who succeed long-term aren’t necessarily the smartest or most connected — they’re the ones who built systematic processes and stuck with them through variance. Start with one market where you believe you have an edge, track everything meticulously, and expand only when the data confirms your approach works.
The 162-game season forgives short-term mistakes but punishes long-term sloppiness. Approach MLB betting as a marathon rather than a sprint, and the edges outlined here compound into meaningful returns for bettors disciplined enough to execute them consistently.
Created by the ”mlb Bets” editorial team.