MLB Prop Bets Guide: Player Props, Strikeouts and Home Run Betting

Prop betting has transformed how fans engage with baseball games. Instead of simply picking winners or totals, you can now bet on individual player performances — how many strikeouts a pitcher will record, whether a batter will hit a home run, or which team scores first. These markets offer both entertainment value and genuine edges for bettors willing to do the analytical work.
The prop betting explosion reflects broader changes in sports gambling. Sportsbooks discovered that recreational bettors love having action on specific players, especially stars they’re watching closely. This demand created deep prop markets that sharp bettors can exploit when pricing inefficiencies appear.
MLB props present unique opportunities because baseball produces clean, countable statistics. A strikeout is a strikeout. A home run is a home run. Unlike football props that depend on game flow and coaching decisions, baseball props often come down to skill matchups that can be projected reliably.
This guide covers every major prop category you’ll encounter at sportsbooks in 2026. You’ll learn how to analyze pitcher props based on matchup data, find value in batter props using split statistics, and identify situations where the market consistently misprice outcomes. The goal isn’t betting every prop available — it’s finding the handful of plays where your analysis reveals genuine edges.
Table of Contents
- Pitcher Props: Strikeouts, Outs Recorded, and Earned Runs
- Batter Props: Total Bases, Hits, Home Runs, and RBIs
- Team Props: Team Totals and First to Score
- Inning Props: Highest-Scoring Inning and Run Expectancy
- Using Matchup Data for Prop Analysis
- Finding Plus-EV Prop Opportunities
- Common Prop Betting Mistakes
- Props in Same-Game Parlays
- Developing Your Prop Betting Edge
Pitcher Props: Strikeouts, Outs Recorded, and Earned Runs
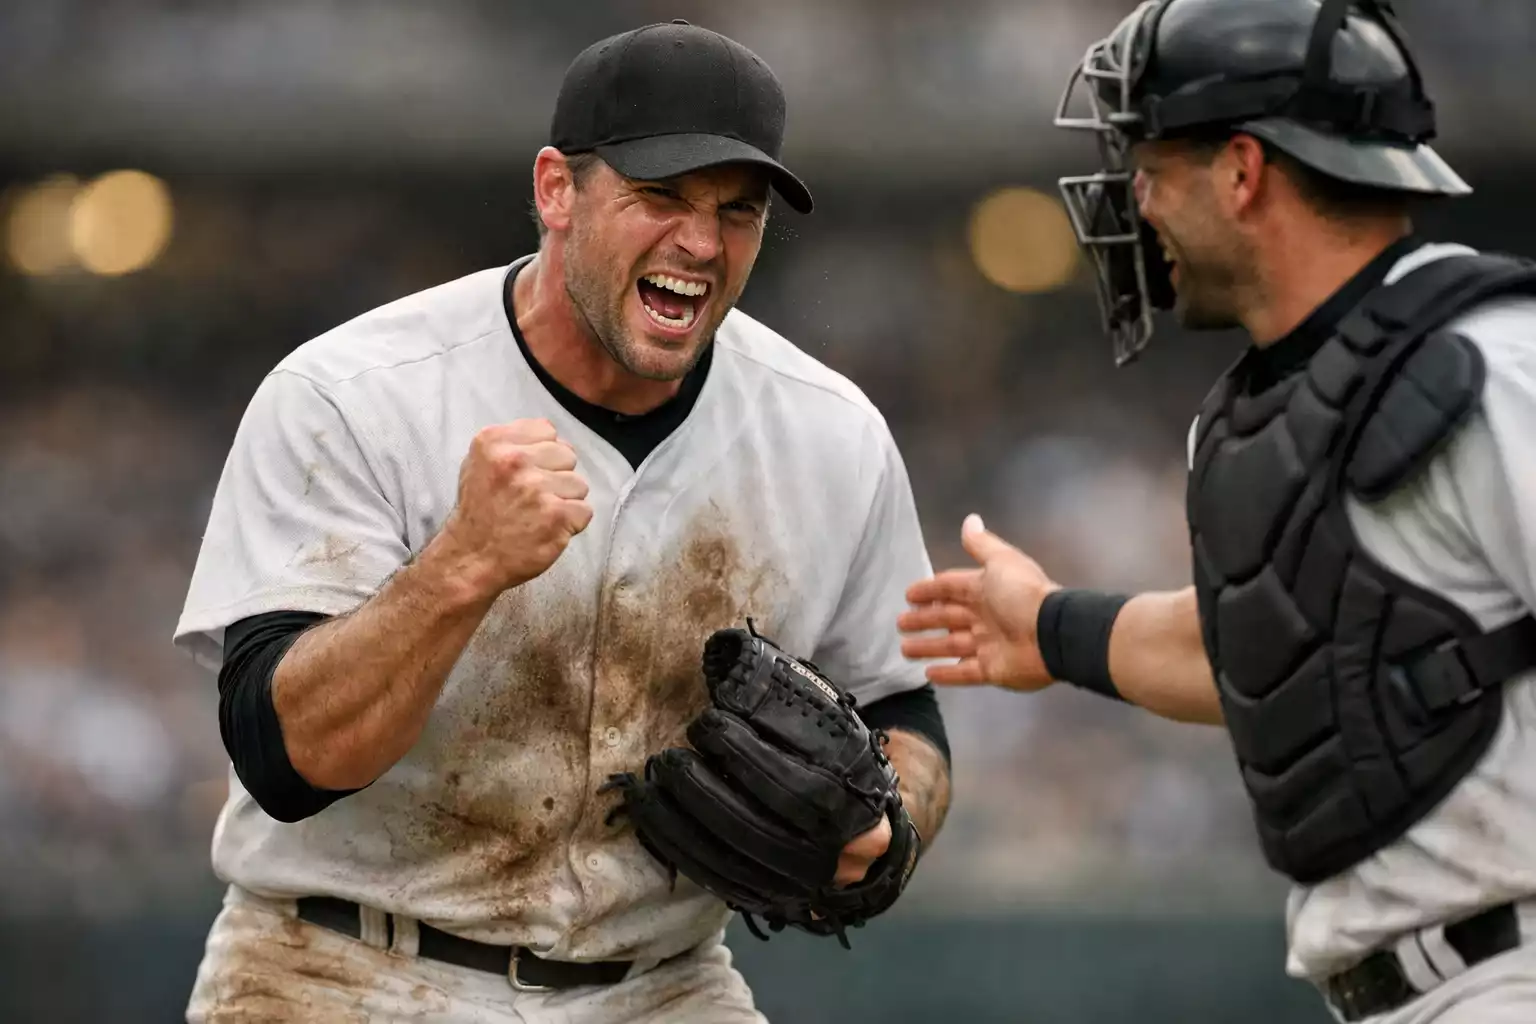
Pitcher strikeout props rank among the most popular and potentially profitable bets in baseball. The premise is simple: will the starting pitcher record more or fewer strikeouts than the number posted? Yet handicapping these props requires layered analysis that goes beyond a pitcher’s seasonal strikeout rate.
Opposing lineup strikeout rates provide the foundation for projections. Teams vary dramatically in how often they strike out — some exceed 25% while others stay below 20%. Facing a high-strikeout lineup inflates expected Ks compared to facing a contact-oriented team. This adjustment often represents the difference between profitable and losing prop bets.
Pitcher workload expectations matter enormously. A starter projected for six innings has more opportunities to accumulate strikeouts than one likely to exit after four. Checking implied game scripts helps project innings — a heavy favorite should pitch deeper than a team likely to trail and see their starter pulled early. When a strong pitcher faces a weak opponent, his strikeout potential increases both through matchup quality and extended workload.
Recent strikeout trends sometimes diverge from season-long rates. A pitcher whose velocity has ticked up over recent starts might be underpriced by markets using full-season data. Conversely, someone showing declining spin rates or command issues could be overvalued based on early-season numbers. Tracking start-to-start changes reveals edges the broader market misses.
Pitcher outs recorded props function similarly to strikeouts but measure workload directly. You’re betting whether a starter completes a certain number of outs (18 outs equals six innings). These props require projecting how deep into games a pitcher will work based on pitch efficiency, game script, and manager tendencies.
Pitch count projections help analyze outs recorded props. Pitchers who average 16 pitches per inning need 96 pitches to reach six innings, while efficient starters might get there in 80. Knowing that most managers pull starters around 100 pitches helps project outer limits for workload props.
Earned run props ask whether a pitcher will allow more or fewer runs than the posted number. These markets carry more variance than strikeout props because runs depend partly on sequencing luck. A pitcher who allows three singles might score zero or three runs depending on how hits cluster. Still, projected run output based on opposing lineup quality and ballpark factors provides a reasonable baseline.
The key to pitcher prop analysis involves understanding what you’re actually betting. Strikeout props reward betting on pure stuff and matchup quality. Outs recorded props bet on efficiency and game script. Earned run props accept higher variance in exchange for larger edges when you identify mispricings.
Combining multiple pitcher prop edges into same-game parlays can amplify returns, though this approach also compounds variance. A pitcher you like for high strikeouts probably also projects for deep innings, creating natural correlation. Building props that work together logically produces better outcomes than combining random selections.
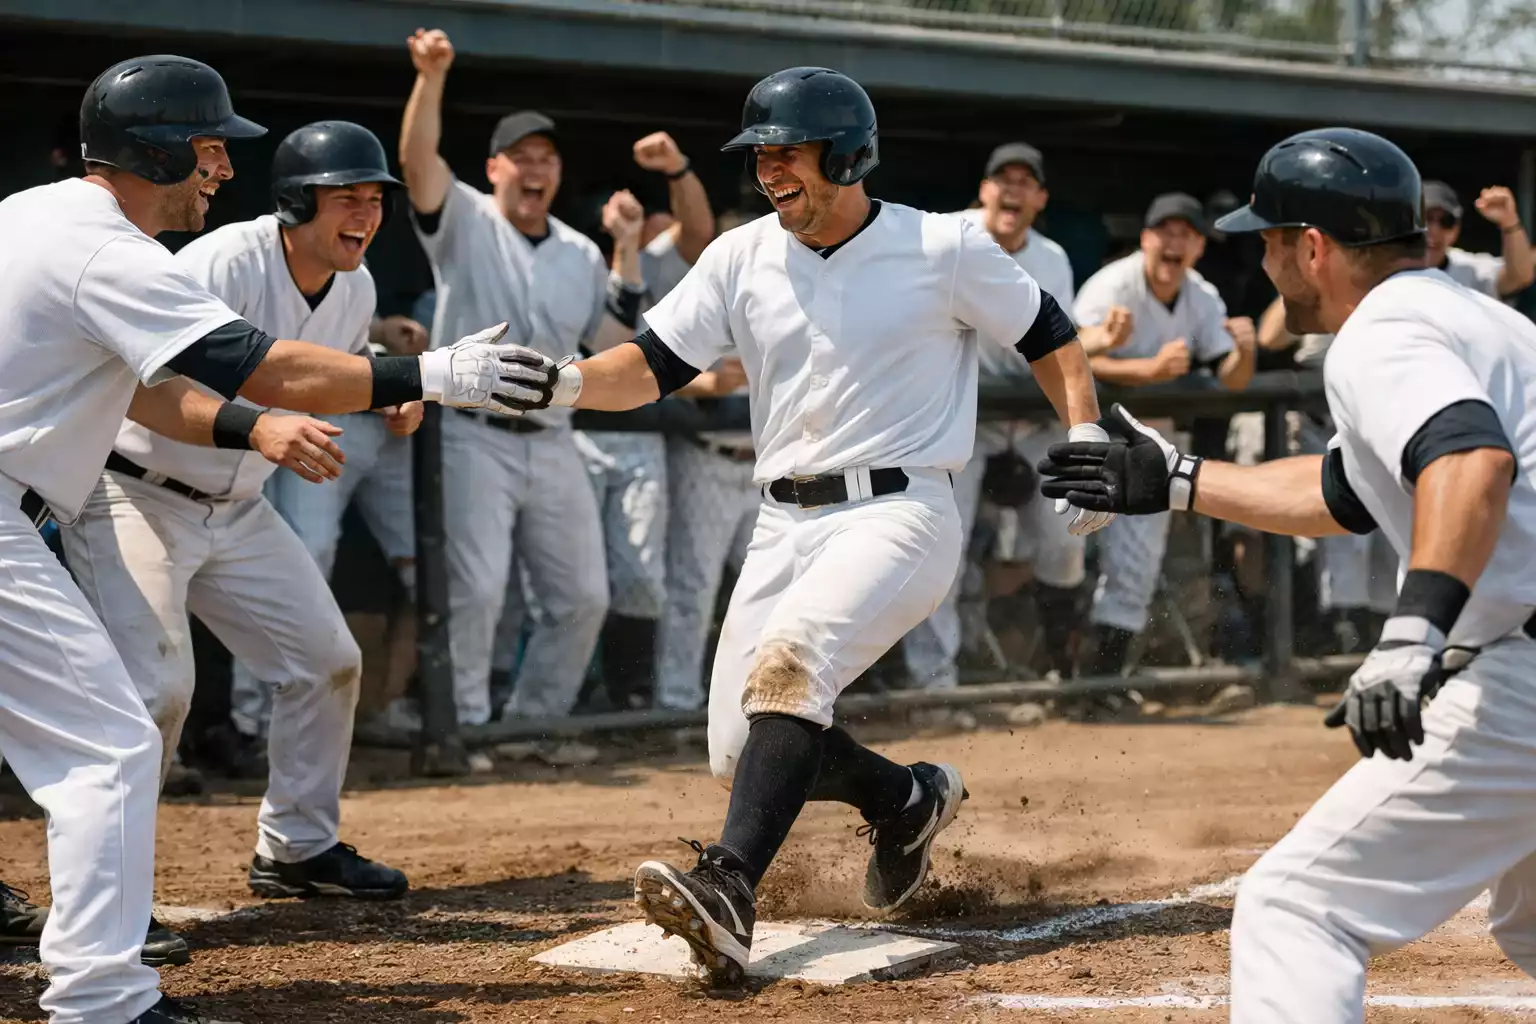
Batter Props: Total Bases, Hits, Home Runs, and RBIs
Batter props offer action on individual hitter performances throughout games. Total bases, hits, home runs, and RBI props each require distinct analytical approaches because they measure different aspects of offensive production with varying degrees of predictability.
Total bases props aggregate all offensive production into a single number. A single equals one base, a double two, a triple three, and a home run four. These props typically post around 1.5 total bases for most hitters, with elite sluggers seeing lines of 2.0 or higher. The over hits when a player records a double or better, or multiple singles over the course of a game.
Analyzing total bases props starts with the opposing pitcher. Pitchers who surrender hard contact allow more extra-base hits regardless of their overall effectiveness. Checking hard-hit rates and barrel percentages against specific pitcher types helps project whether a hitter will generate the quality contact needed to beat total bases overs.
Power versus contact hitters perform differently in total bases markets. A slugger might go 1-for-4 with a home run for four total bases, while a contact hitter goes 2-for-4 with singles for two total bases. Understanding each hitter’s profile helps project which side of the line they’re more likely to land on.
Hits props measure plate appearances that result in any hit type. These markets typically post around 0.5 or 1.5 hits depending on the player and matchup. The 1.5 line requires multi-hit games, making lineup position and expected plate appearances crucial factors.
Leadoff hitters and those batting in high-turnover spots see more plate appearances, creating more opportunities for hits. A player batting second expects five plate appearances per game in most contexts, while the eighth-place hitter might see only three or four. This difference significantly impacts hit prop probabilities.
Opposing pitcher contact rates and BABIP allowed help project hits props. Some pitchers allow weak contact that defenders convert into outs, while others surrender hard-hit balls that find holes regardless of defensive positioning. Matching hitter tendencies against pitcher profiles reveals expected outcomes.
Home run props present high-risk, high-reward propositions. Even elite sluggers hit home runs in only about 5% of plate appearances, meaning the over loses frequently even when you’ve identified positive expected value. Home run props require accepting massive variance in exchange for plus-money payouts.
Projecting home run props involves isolating fly ball hitters against fly ball pitchers in favorable ballparks. A power hitter facing a pitcher who allows elevated contact at a hitter-friendly park has significantly better home run odds than the same hitter at a pitcher’s park against a ground ball specialist.
Weather conditions affect home run props more than other batter markets. Wind blowing out, warm temperatures, and low humidity all increase home run probability. Check game-time forecasts rather than morning reports, as conditions can shift significantly throughout the day.
RBI props depend heavily on lineup context and opportunity rather than individual skill. A great hitter in a weak lineup might never see runners on base, while an average hitter following strong on-base guys accumulates RBIs through volume. These props reward lineup analysis over individual player projection.
Projecting RBIs requires estimating runners on base when a hitter comes to the plate. This depends on the on-base percentages of preceding lineup spots and expected plate appearances. A cleanup hitter behind three players with .350 OBPs sees dramatically more RBI chances than one following .280 OBP guys.
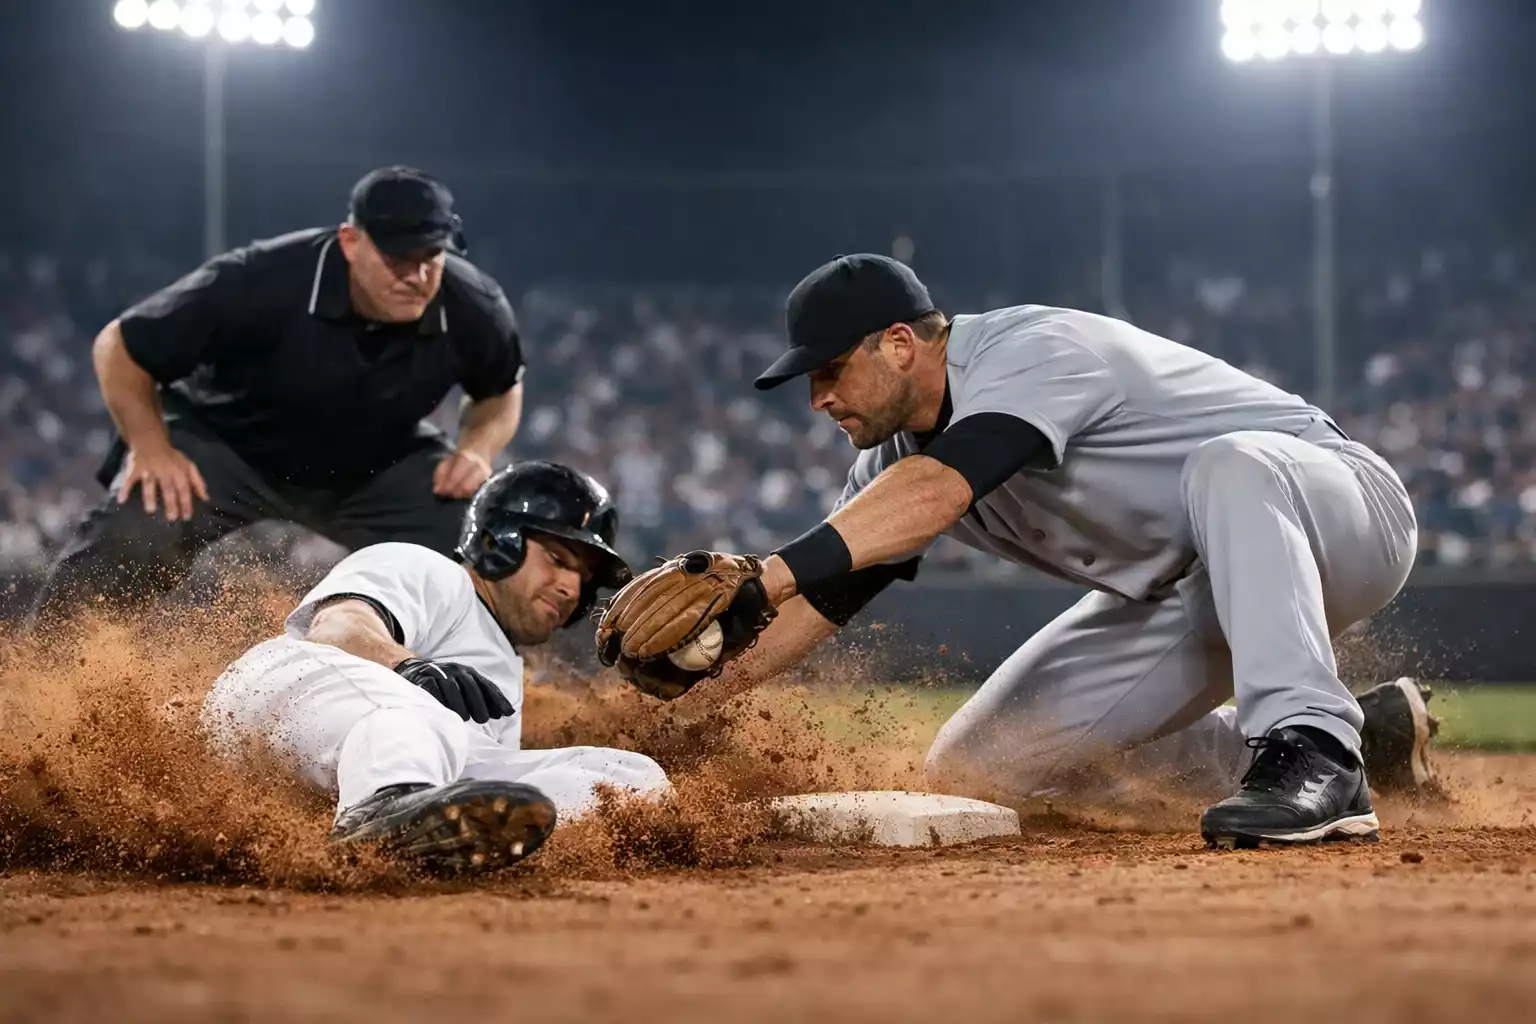
Team Props: Team Totals and First to Score
Team props shift focus from individual players to squad-level performance. Team total runs and first-to-score props each offer different risk-reward profiles and analytical requirements.
Team totals ask whether a specific team will score more or fewer runs than a posted number. Unlike full-game totals that aggregate both teams, team totals let you isolate your projection on one side. If you believe the Dodgers will crush a weak starter but expect a pitching duel from the other side, team totals let you express that view cleanly.
Projecting team totals uses the same factors as full-game totals — starting pitcher quality, bullpen depth, lineup strength, and ballpark effects — but focused on one team’s scoring. This precision helps when you have stronger opinions about one side than the entire game.
First-to-score props bet on which team plates a run first. These markets typically price close to even money with slight juice adjustments based on home-field advantage and lineup construction. The visiting team bats first, giving them the initial opportunity, but home teams often feature stronger top-of-order hitters who capitalize when they reach the plate.
Projecting first-to-score involves analyzing the first few innings specifically rather than full-game run production. Pitchers usually perform best early before fatigue sets in, so first-inning scoring depends heavily on top-of-order matchups against fresh starting pitching. Check leadoff hitter on-base rates and cleanup hitter power against the specific opposing starter.
Inning Props: Highest-Scoring Inning and Run Expectancy
Inning-specific props add granularity to baseball betting beyond full-game and player markets. These bets focus on when scoring happens rather than just whether it happens, requiring different analytical approaches than traditional markets.
Highest-scoring inning props bet on which single inning produces the most runs. You might bet that the fifth inning will be the highest-scoring frame, or that first-inning totals exceed any other. These props require projecting scoring distribution across game stages rather than just total runs.
Early innings typically see lower scoring because starting pitchers perform best when fresh. As games progress into the middle innings, pitcher fatigue and bullpen transitions create more scoring opportunities. Late innings can explode if tired relievers face strong lineups or collapse if dominant closers take over.
The specific matchup dictates scoring distribution patterns. Games featuring two aces might see sparse scoring throughout with any runs coming from isolated mistakes. Games with weak starters often see early scoring before managers go to their bullpens. Understanding these game scripts helps project which innings offer scoring potential.
Run expectancy by inning provides baseline probabilities for these markets. On average, teams score roughly 0.5 runs per inning across all MLB games, but this varies significantly by inning position. First innings see slightly below-average scoring, middle innings cluster near average, and late innings vary wildly based on game state and leverage.
First-inning scoring props, particularly NRFI/YRFI bets, deserve special attention. These quick-resolution markets depend heavily on starting pitcher first-inning tendencies and opposing leadoff hitters. Some pitchers consistently struggle in the first inning while finding rhythm later, creating systematic edges for those tracking these patterns.
Odd versus even inning props occasionally appear at sportsbooks, betting whether more runs score in odd-numbered or even-numbered innings. These markets require less precise inning-by-inning projection and more general understanding of scoring patterns. Because starting pitchers typically work through at least the fifth inning, odd innings (1, 3, 5) often see starter-dominated pitching while even innings more frequently involve bullpen transitions.
Using Matchup Data for Prop Analysis
Raw statistics only tell part of the story for prop betting. Matchup-specific data reveals how individual players perform against particular pitcher types, handedness, and pitch arsenals. Incorporating these granular splits improves prop projections significantly.
Platoon splits provide the starting point for matchup analysis. Most hitters perform better against opposite-handed pitchers, but the magnitude varies dramatically between players. A hitter with a .350 wOBA against right-handed pitching but .280 against lefties requires different projections based on the opposing starter’s handedness.
Pitcher arsenal matchups add another analytical layer. Some hitters crush fastballs but struggle against breaking balls. Others feast on off-speed pitches while whiffing on velocity. Matching hitter tendencies against pitcher pitch mixes helps project performance beyond what simple platoon splits reveal.
Velocity bands matter for prop projections. Hitters who struggle against high-velocity pitchers face tougher matchups against fireballers regardless of handedness. Similarly, pitchers with elite velocity gain advantages against lineups full of hitters with poor fastball metrics. Checking velocity-specific splits helps identify overlooked matchup edges.
Recent performance trends deserve consideration when they deviate from long-term averages. A hitter suddenly seeing the ball better — evidenced by improved exit velocities and hard-hit rates — might outperform seasonal statistics. Conversely, someone showing declining bat speed could disappoint relative to past numbers. These trends require watching actual game footage or tracking Statcast metrics over short windows.
Historical batter-versus-pitcher matchups provide interesting data points but require careful interpretation. Small sample sizes make individual matchup history unreliable — a hitter going 5-for-10 against a particular pitcher might regress dramatically in future meetings. Use historical matchups as one input among many rather than overweighting limited head-to-head data.
Park factors interact with matchup analysis for prop betting. A fly ball hitter facing a fly ball pitcher at Coors Field has dramatically better home run odds than the same matchup at Oracle Park. Always adjust matchup projections for the specific venue where the game is played.
Weather conditions similarly affect matchup-based projections. That same favorable fly ball matchup produces fewer home runs on cold April nights than warm August afternoons. Layering environmental factors onto matchup analysis produces more accurate prop projections than either element alone.
The goal of matchup analysis isn’t finding perfect information — it’s being more right than the market more often. If your analysis suggests a hitter’s true strikeout odds are 20% against a particular pitcher but the prop prices imply 30%, you’ve found potential value regardless of the actual outcome. Making these small-edge bets consistently over large samples produces profit even when individual props lose.
Finding Plus-EV Prop Opportunities

Identifying positive expected value in prop markets requires comparing your projections against implied probabilities from betting odds. When you believe a prop hits more often than the odds suggest, you’ve found potential plus-EV — the foundation of long-term betting profit.
Converting odds to implied probability is straightforward. A -150 line implies the outcome happens 60% of the time. A +120 line implies 45.5%. If your analysis projects the actual probability at 55% for that +120 line, you’ve found value even though the prop loses nearly half the time.
Line shopping becomes essential for prop betting because odds vary significantly across sportsbooks. One book might post a strikeout prop at over 5.5 at -120 while another offers the same prop at over 5.5 at -105. That 15-cent difference dramatically affects long-term profitability when multiplied across hundreds of bets.
Soft lines often appear when sportsbooks don’t fully account for matchup factors. A pitcher facing a high-strikeout lineup might see identical strikeout props regardless of opponent because books use seasonal rates rather than matchup-adjusted projections. Bettors who make these adjustments capture edges the market leaves available.
Timing matters for prop betting value. Lines move throughout the day as information emerges and sharp action hits the market. Grabbing a number early before lineup announcements might mean betting a prop that loses value once the full context is known. Alternatively, waiting too long means missing favorable odds before they disappear.
Track your prop bets meticulously with expected value calculations attached. Over time, this data reveals which prop types and matchup situations produce genuine edges versus which ones you’re misjudging. Maybe your strikeout projections are sharp but your home run analysis needs work. The data points toward improvement.
Common Prop Betting Mistakes
Recreational prop bettors make predictable errors that sharp bettors avoid. Understanding these pitfalls helps you construct a more disciplined approach to prop betting.
Betting favorite players regardless of matchup ranks as the most common mistake. Just because you want a star hitter to crush homers doesn’t mean the matchup supports betting the over on his home run prop. Emotional attachment to players leads to poor value assessment — bet numbers, not names.
Ignoring juice destroys prop betting bankrolls slowly. Props often carry significant vig, sometimes -130 or worse on both sides. This juice means you need to win well over 50% of bets just to break even. Account for the vig when calculating whether apparent edges actually exist.
Overweighting small sample matchup data leads to false confidence. A hitter going 7-for-12 against a particular pitcher over four games tells you almost nothing reliable about the next matchup. Statistical noise dominates small samples — trust process over results when samples don’t support conclusions.
Chasing losses through prop volume accelerates losing streaks. After a bad day on props, the temptation is to bet more props trying to recover. This desperation leads to looser standards and more marginal bets that compound losses rather than reversing them.
Failing to adjust for lineup position hurts hits and RBI prop analysis. A hitter typically batting leadoff who moves to sixth for one game sees fewer plate appearances and RBI opportunities. Always check actual lineup position rather than assuming standard spots.
Props in Same-Game Parlays
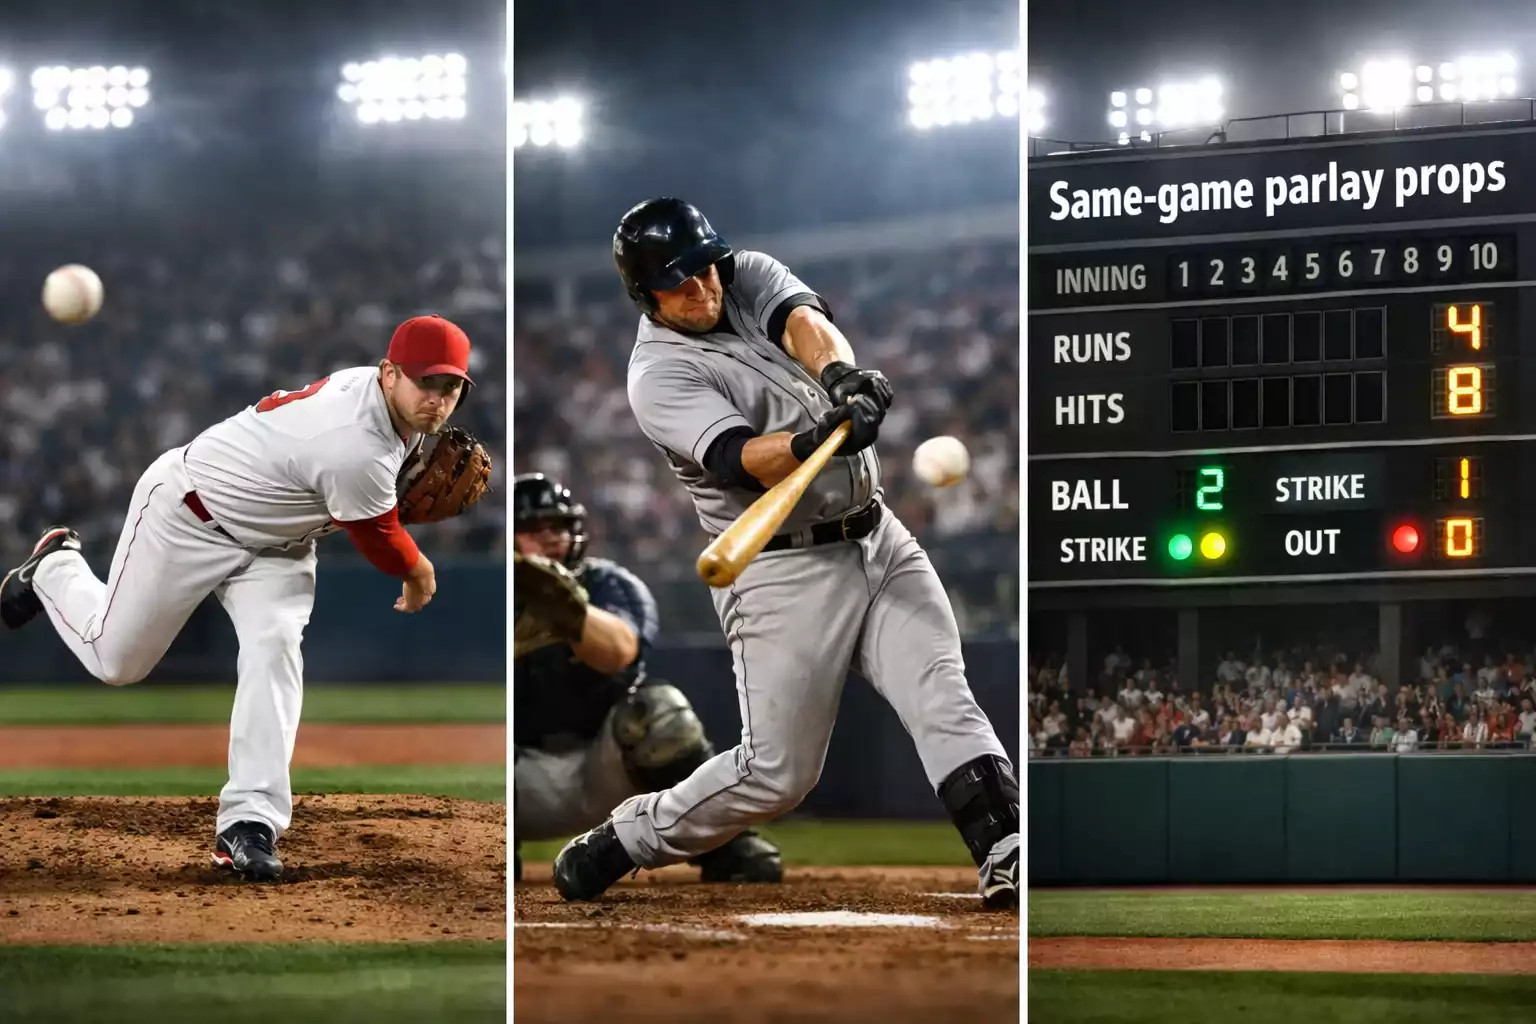
Same-game parlays (SGPs) combine multiple props from a single game into one correlated bet. These products offer attractive payouts but require understanding how correlation affects expected value and variance.
Positive correlation between legs improves parlay value compared to parlaying independent events. If you bet a pitcher’s strikeout over and his team’s win, these outcomes correlate positively — high-strikeout games often come from dominant pitching performances that lead to victories. The combined probability exceeds what you’d calculate treating legs as independent.
Building logically correlated SGPs means identifying props that naturally move together. A game going over the total correlates with both teams scoring well, which correlates with hitters accumulating total bases. Stacking overs across correlated categories produces better expected value than random prop combinations.
Negative correlation destroys SGP value without bettors realizing. Betting one team to win big while their hitters go under on counting stats creates logical tension — blowout wins typically involve offensive explosions that push hitters over their props. These contradictory combinations lower win probability below what the payout suggests.
The variance on SGPs exceeds single prop bets dramatically. Even well-constructed parlays lose frequently because multiple outcomes must all hit. Accept this variance as the cost of chasing larger payouts, and size SGP bets smaller than single prop plays.
Developing Your Prop Betting Edge
Successful prop betting requires the same discipline as any betting market — systematic analysis, bankroll management, and honest result tracking. The difference lies in the granularity of projections and the volume of available opportunities.
Start by specializing in one prop type rather than betting everything available. Maybe you develop expertise in pitcher strikeout props through careful matchup analysis. Perhaps batter total bases props suit your analytical strengths. Depth beats breadth when developing genuine edges.
The MLB season provides thousands of prop betting opportunities across 2,430 games. Finding even a small edge on certain prop types produces meaningful returns when multiplied across large samples. The bettors who profit from props aren’t those swinging wildly at every market — they’re the ones who found specific situations where their analysis consistently outperforms the sportsbooks’ pricing.
Prepared by the mlb Bets editorial staff.