How to Analyze MLB Matchups: Pitchers, Weather and Ballpark Factors

Every MLB game tells a story before the first pitch is thrown. The starting pitchers, bullpen availability, lineup construction, weather forecast, and ballpark dimensions all combine to create a unique betting environment that differs from the game played yesterday and the one scheduled tomorrow. Bettors who understand how to read these factors systematically gain edges over those who simply look at team records and recent form.
Matchup analysis separates serious handicappers from casual bettors placing wagers based on gut feelings. The process involves gathering relevant data, weighing each factor appropriately, and synthesizing everything into a coherent projection. This sounds complicated, but it becomes second nature with practice. The goal isn’t perfection — it’s being more right than the market more often than not.
This guide walks through each major component of MLB matchup analysis. You’ll learn which pitcher stats actually predict future performance, how to evaluate bullpen strength beyond closer names, why lineup changes matter more in some spots than others, and how environmental factors like weather and ballpark dimensions should influence your betting decisions. By the end, you’ll have a framework for breaking down any game on the schedule.
The best part about systematic matchup analysis is that it removes emotion from the equation. Instead of betting your favorite team or fading a squad that burned you last week, you’re making decisions based on observable, quantifiable factors. This discipline pays dividends over the long 162-game season where variance eventually rewards process over luck.
Table of Contents
- Evaluating Starting Pitchers: The Stats That Matter
- Bullpen Depth and Recent Usage
- Lineup Analysis and Injury Impact
- Platoon Advantages: Left-Right Splits
- Weather Effects on MLB Totals
- Ballpark Dimensions and Run Environments
- Umpire Tendencies and Strike Zones
- Schedule Spot Analysis
- Putting It All Together: Sample Matchup Breakdown
- Building Your Matchup Analysis Process
Evaluating Starting Pitchers: The Stats That Matter

Starting pitchers influence MLB betting lines more than any other single factor. When an ace takes the mound, his team might be favored by 50 cents or more compared to the same matchup with a replacement-level starter. Understanding which pitching stats actually predict future performance helps you identify when the market is overvaluing or undervaluing a starter.
ERA remains the most commonly cited pitching statistic, but it contains significant noise that makes it unreliable for betting purposes. A pitcher’s ERA depends heavily on factors outside his control — defensive quality behind him, sequencing of hits and walks, and luck on balls in play. Two pitchers with identical skills can post wildly different ERAs over a half-season based purely on circumstances.
FIP (Fielding Independent Pitching) strips away the noise by focusing only on outcomes pitchers control directly: strikeouts, walks, hit batters, and home runs. This metric correlates much better with future performance than ERA. A pitcher with a 4.50 ERA but 3.20 FIP has likely been victimized by poor defense or bad luck; expect his results to improve. The opposite pattern — low ERA, high FIP — signals regression toward worse outcomes.
xFIP takes the analysis further by normalizing home run rates to league average. Home runs allowed fluctuate significantly based on fly ball luck, so xFIP provides an even cleaner view of underlying pitcher quality. When evaluating starters for betting purposes, comparing ERA to FIP and xFIP reveals whether a pitcher has been lucky or unlucky — and in which direction he’s likely to regress.
Strikeout rate (K/9 or K%) deserves attention because strikeouts eliminate defensive variability entirely. A pitcher who misses bats consistently doesn’t need good fielding behind him. High-strikeout pitchers tend to maintain their performance levels more reliably, making them safer bets in uncertain situations. When two starters have similar FIPs but different strikeout rates, the higher-strikeout pitcher typically offers more predictable outcomes.
Walk rate matters for the opposite reason — free passes create baserunners without requiring the opposing hitters to do anything. Pitchers with high walk rates face constant danger of big innings when a few hits follow the free passes. For totals betting especially, walk-prone pitchers push games toward overs regardless of their other skills.
WHIP (walks plus hits per inning pitched) combines these factors into a single measure of baserunner prevention. Lower WHIP generally means fewer scoring opportunities for opponents, but the stat doesn’t distinguish between types of baserunners. A single and a walk hurt equally in WHIP calculations, though their actual impact differs situationally.
Recent workload affects starter evaluation significantly. A pitcher coming off a 120-pitch outing might not have his best stuff on normal rest. Conversely, extra rest sometimes helps older pitchers recover arm strength. Tracking pitch counts and rest days adds context that pure statistics miss.
Matchup history between a starter and the opposing lineup provides another data point, though sample sizes are often too small to be meaningful. If a pitcher has faced a team twice and allowed eight runs, that could reflect a genuine bad matchup or simply two unlucky outings. Weight historical matchups appropriately — they matter, but less than underlying skills suggest.
Bullpen Depth and Recent Usage
Modern baseball increasingly relies on bullpens to finish games. Starting pitchers rarely complete seven innings anymore, meaning relief pitcher quality and availability significantly impact game outcomes. Yet most casual bettors ignore bullpen analysis entirely, focusing only on the names in the starting rotation.
Evaluating bullpen strength requires looking beyond the closer. While elite closers get the headlines, the setup men and middle relievers often determine whether games reach the ninth inning with a lead to protect. A team with a dominant closer but weak setup options bleeds leads in the seventh and eighth innings, rendering that closer irrelevant.
Recent usage tracking provides critical context for bullpen evaluation. Relief pitchers lose effectiveness on consecutive-day appearances, especially after high-pitch outings. A setup man who threw 30 pitches yesterday and 25 the day before probably isn’t available at full strength today. Managers might use him anyway in high-leverage spots, but expecting peak performance is unrealistic.
The best bullpen analysis tracks not just who pitched recently but how much stress those outings involved. A clean inning with three quick outs differs significantly from a high-leverage appearance with runners inherited. Mental and physical fatigue accumulate differently based on situation intensity, affecting next-day availability beyond what simple pitch counts suggest.
Bullpen ERA and FIP work similarly to starter metrics but with important caveats. Relievers face smaller samples and more variable competition — sometimes they face the heart of the order, sometimes the bottom third. Their numbers fluctuate more dramatically than starters, making underlying skill metrics like strikeout and walk rates even more important for projection purposes.
For full-game betting, bullpen strength matters most in close games where leverage escalates as innings progress. If you project a tight game between evenly matched starters, bullpen quality becomes the tiebreaker. Conversely, projected blowouts render bullpen analysis mostly irrelevant since low-leverage situations don’t require top relievers.
Lineup Analysis and Injury Impact
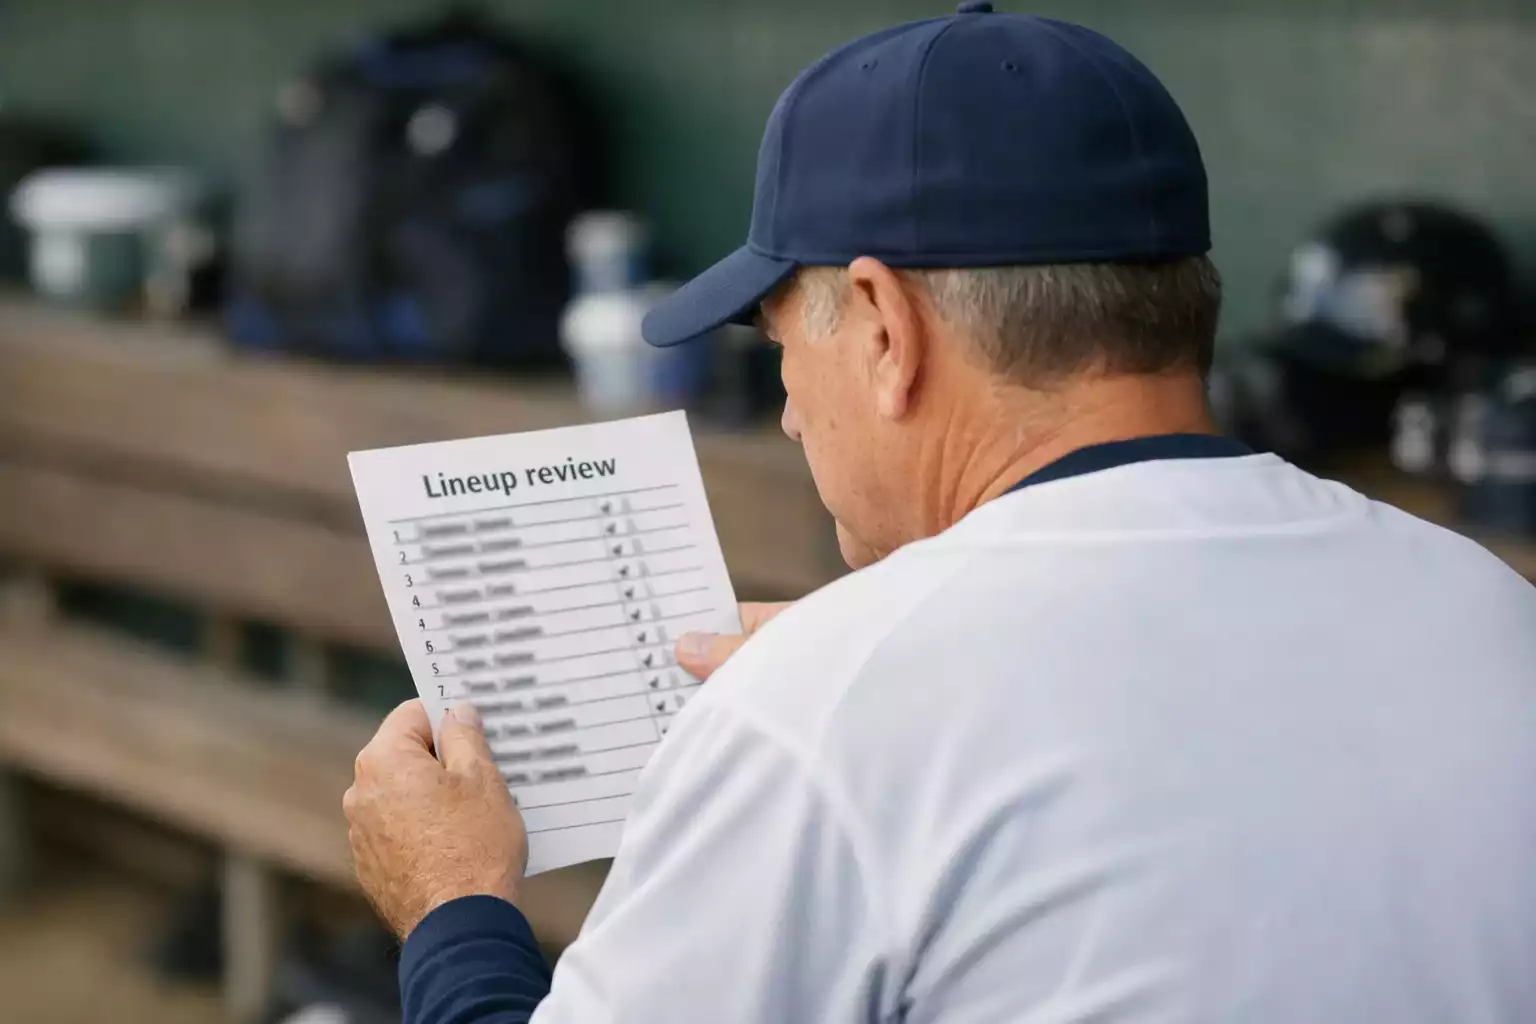
Starting lineups announce approximately 60-90 minutes before first pitch, and sharp bettors monitor these releases closely. A star player sitting out can swing a line multiple cents, creating brief windows where stale lines offer value before sportsbooks adjust.
Quantifying lineup impact requires understanding each hitter’s contribution to expected run production. A team missing their cleanup hitter loses more offensive value than one resting their eighth-place bat. Positional context matters too — losing your starting catcher often hurts more than statistics suggest because backup catchers typically hit poorly and may struggle with game-calling duties.
Run expectancy tables help quantify these impacts. If a typical lineup produces 4.5 expected runs per game and the best hitter accounts for 15% of offensive value, his absence drops the projection to roughly 3.8 runs. Whether the market properly adjusts for this change determines whether betting value exists.
Injury context matters beyond simple presence or absence. A player returning from injury might be rusty or limited. A hitter playing through a nagging issue might stay in the lineup but with diminished production. Tracking injury reports and watching for changes in player performance helps identify situations where lineup cards don’t tell the full story.
Late scratches create the most exploitable situations. When a star player gets pulled from the lineup 30 minutes before first pitch, sportsbooks scramble to adjust lines. This window provides opportunities for bettors monitoring news feeds to grab favorable numbers before the market fully reacts.
Platoon Advantages: Left-Right Splits
Baseball’s platoon advantage — where batters generally perform better against opposite-handed pitchers — creates consistent edges for matchup analysis. Right-handed batters hit better against left-handed pitchers, and vice versa. This isn’t folklore; it’s a measurable, persistent phenomenon rooted in pitch visibility and movement patterns.
Understanding platoon splits helps project scoring in specific matchups. A left-handed starter facing a lineup stacked with right-handed hitters faces tougher sledding than one facing a lefty-heavy lineup. Some pitchers handle opposite-handed hitters well enough to neutralize the platoon advantage, but these exceptions require individual analysis.
Lineup construction often reflects platoon considerations. Managers stack right-handed hitters against left-handed starters and vice versa, maximizing their offensive chances. Recognizing when a team has platoon advantages throughout the lineup helps project run production more accurately than simple team statistics suggest.
Split statistics for individual hitters reveal who benefits most from platoon situations. Some hitters crush same-handed pitching contrary to expectations; others struggle so much against same-handed arms that they ride the bench in those matchups. Checking individual splits before games helps identify which hitters might over-perform or under-perform relative to their overall numbers.
Pitcher splits work similarly. Some starters destroy same-handed hitters while struggling against opposite-handed bats. Others show minimal split differences, making them harder to exploit through lineup construction. Identifying pitchers with extreme splits helps project scoring based on the specific lineup they’ll face.
The betting market generally accounts for platoon advantages, but not always efficiently. Particularly in smaller markets like first five innings or team totals, split-based analysis can reveal mispricings that sharper bettors exploit consistently over large samples.
Weather Effects on MLB Totals

Weather influences baseball scoring more than most bettors realize. Temperature, wind speed and direction, humidity, and air pressure all affect how baseballs travel and how pitchers grip their offerings. Incorporating weather analysis into matchup evaluation provides edges in totals markets where these factors directly impact expected runs.
Wind direction matters most at parks without enclosed domes. Wind blowing out to center field at 15 mph or higher can add a full run to expected scoring, turning warning-track fly balls into home runs. Wind blowing in suppresses offense similarly, keeping potential homers in the yard and turning line drives into catchable flies. Crosswinds create unpredictability that benefits neither side consistently.
Temperature affects ball flight significantly. Hot air is less dense than cold air, allowing baseballs to travel farther on the same contact. Games played in 90-degree heat produce more scoring than identical matchups in 60-degree weather. Early-season cold games in northern cities consistently under-perform run expectations compared to summer contests.
Humidity’s impact is often overstated by casual bettors. While humid air theoretically allows balls to travel farther (water vapor is lighter than nitrogen and oxygen), the effect is minimal compared to temperature and wind. Don’t overweight humidity in your analysis, but do note extreme conditions that might push totals slightly in one direction.
Air pressure and altitude create the most dramatic effects. Denver’s thin air at Coors Field produces notorious scoring environments, with totals regularly exceeding 11 runs. The market knows this, but sometimes overcompensates — unders at Coors can offer value when two quality pitchers face off and the total inflates beyond reasonable expectations.
Rain and weather delays introduce uncertainty that’s difficult to model. Games called before becoming official can void bets at some sportsbooks, while delays disrupt pitcher rhythm and potentially bring relievers into action earlier than planned. When significant rain chances exist, consider whether the added uncertainty suits your betting approach or creates unwanted variance.
Weather forecasts change throughout the day, creating opportunities for bettors who monitor conditions. A morning forecast showing calm conditions might shift to 20 mph winds by game time. Grabbing a number early before the market adjusts to updated forecasts captures value that disappears once new information is widely known.
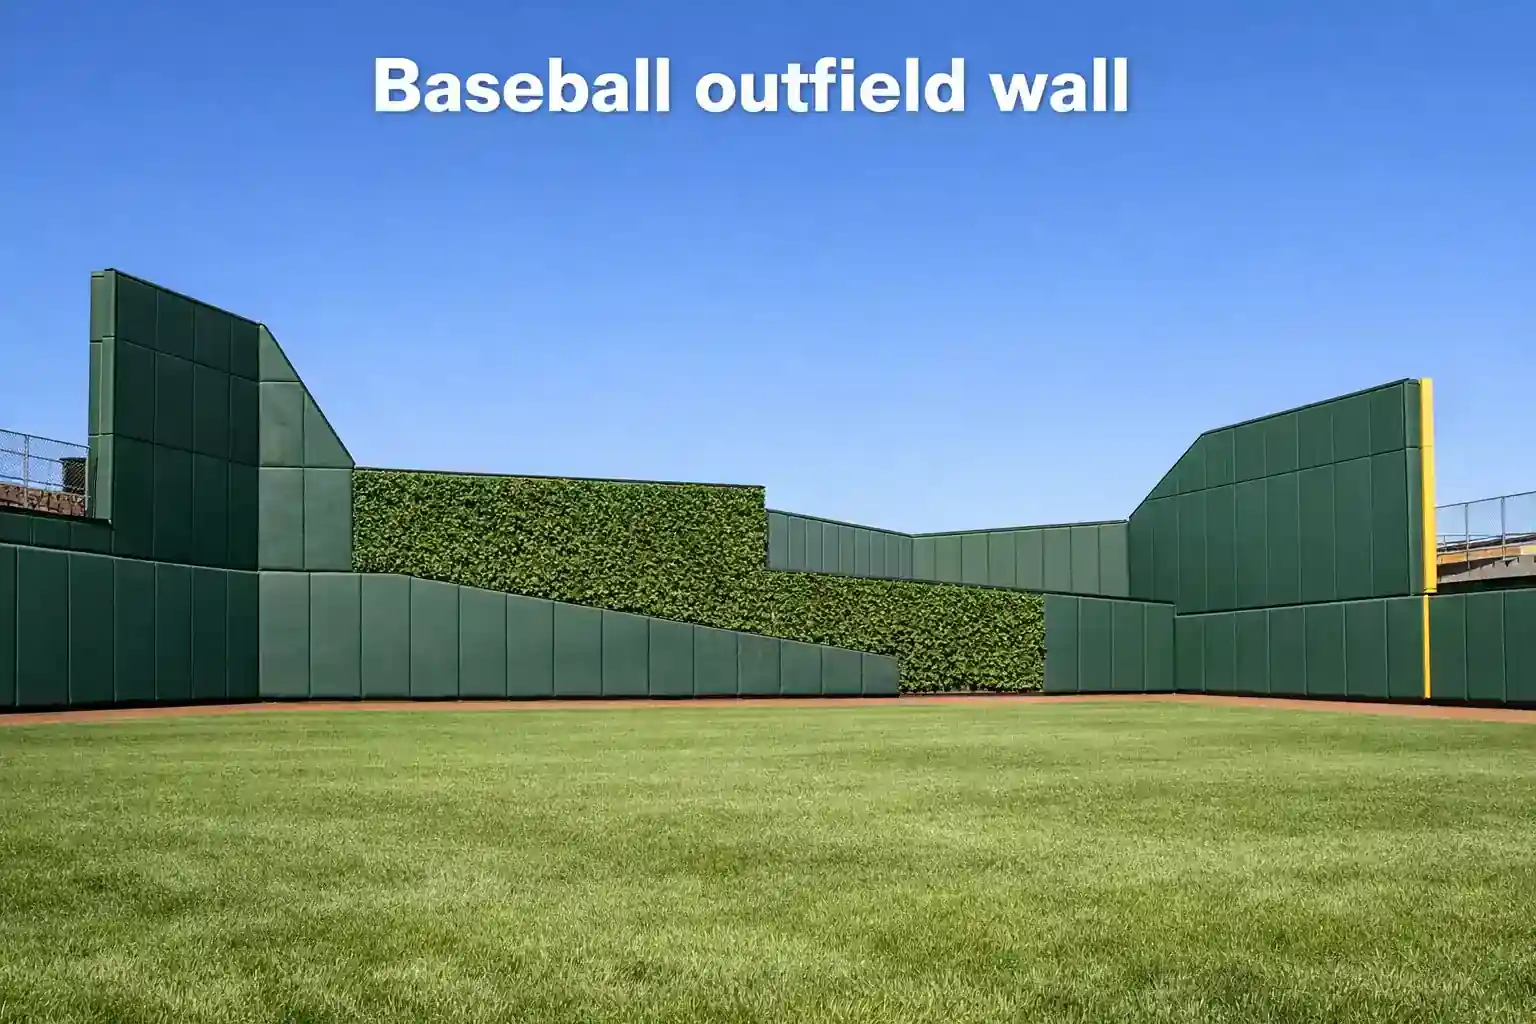
Ballpark Dimensions and Run Environments
Each MLB ballpark plays differently based on dimensions, altitude, and atmospheric conditions. These park effects persist year over year, making them reliable factors for matchup analysis rather than noise to ignore.
Park factors quantify how much each stadium inflates or deflates scoring relative to league average. A park factor of 105 means the stadium increases scoring by approximately 5% compared to neutral conditions. Coors Field in Denver consistently shows the highest park factor, often exceeding 115, while pitcher-friendly parks like Oracle Park in San Francisco regularly fall below 95.
Outfield dimensions affect scoring in predictable ways. Short porches turn fly balls into home runs, while cavernous outfields allow defenders to track down deep drives. Left field at Yankee Stadium plays short, benefiting right-handed power hitters. Fenway Park’s Green Monster in left field creates unique dynamics — some fly balls become wall doubles, while others that would clear shorter fences bounce back for singles.
Foul territory varies significantly between stadiums. Parks with large foul areas give pitchers extra outs on foul pop-ups that would land in stands at other venues. Oakland Coliseum’s extensive foul ground historically benefited pitchers, while stadiums with minimal foul territory favor hitters by extending at-bats.
Surface type matters less than in previous eras since most MLB stadiums now use natural grass. The few remaining artificial turf stadiums affect ball speed and bounce, theoretically boosting offense, though the impact is modest compared to other park factors.
Applying park factors to matchup analysis requires adjusting expectations appropriately. If a pitcher has a 3.50 ERA compiled mostly in pitcher-friendly parks, his true talent might be closer to 3.80 in a neutral environment. When he travels to a hitter-friendly park, expect results worse than his surface-level stats suggest. This adjustment helps project totals and game outcomes more accurately.
Park factors affect certain hitter types more than others. Fly ball hitters benefit most from shorter dimensions and thin air, while ground ball hitters care less about outfield walls. A lineup full of fly ball power hitters playing at Coors Field poses more danger than one built on speed and contact, even if both lineups have similar overall production numbers.
Time of year interacts with ballpark effects. Day games at Wrigley Field play differently in April versus August due to temperature and wind pattern changes. Night games at coastal parks like San Diego can see marine layer effects that suppress ball flight compared to afternoon starts. Tracking these seasonal patterns within parks adds nuance to your projections.
Umpire Tendencies and Strike Zones
Home plate umpires call balls and strikes differently, affecting game outcomes in measurable ways. Some umpires run tight strike zones that favor hitters by calling borderline pitches as balls. Others expand the zone, giving pitchers additional room to work and producing more strikeouts with fewer walks.
Umpire data tracking reveals consistent patterns over large samples. Certain umpires consistently produce higher-scoring games due to tight zones that extend counts and create hitter-friendly environments. Others suppress scoring by letting pitchers work the edges effectively. These tendencies persist across seasons, making umpire assignments genuinely predictive rather than random noise.
Applying umpire analysis to totals betting makes intuitive sense — a hitter-friendly umpire pushes expectations toward the over, while a pitcher-friendly assignment suggests under value. The edges are modest, perhaps worth a quarter run in extreme cases, but consistent edges compound over hundreds of bets across a season.
Umpire information typically becomes available the day before games, giving bettors time to incorporate assignments into analysis. Some sportsbooks adjust lines slightly based on umpire tendencies; others don’t. Finding books slow to react to umpire news creates opportunities for those tracking this data systematically.
The impact of umpire tendencies varies by pitching matchup. A pitcher who lives on the corners benefits enormously from an expanded zone, while a power pitcher who works middle-in cares less about borderline calls. Similarly, free-swinging lineups might not benefit from a tight zone as much as patient teams that work deep counts.
Schedule Spot Analysis
Where a game falls in the broader schedule affects team performance in ways the market sometimes undervalues. Travel fatigue, emotional letdowns, and look-ahead situations all create predictable patterns that inform matchup analysis.
Travel creates measurable disadvantages, especially when crossing time zones. A team arriving in a new city at 3 AM after a West Coast trip faces physiological challenges the home team doesn’t share. These effects are strongest on the first day in a new location and fade as the series progresses.
Day games following night games put road teams at particular disadvantage. After playing until 10 PM, traveling, and arriving at hotels after midnight, players must prepare for a noon first pitch. Home teams face the same timeline but sleep in their own beds and follow familiar routines. Betting against road teams in these spots offers small but consistent edges.
Emotional context matters for scheduling analysis. Teams coming off devastating losses — walk-off defeats, blown leads, playoff elimination — sometimes play flat in their next game. Conversely, teams riding emotional highs occasionally overperform expectations. While these psychological factors are harder to quantify than travel schedules, they deserve consideration in close handicapping decisions.
Look-ahead situations occur when teams face marquee opponents following mundane matchups. A team hosting their division rival on Friday might underperform against a weaker opponent on Thursday, mentally preparing for the bigger series. These situations require reading specific circumstances rather than following rigid rules.
End-of-season schedule spots create unique dynamics. Teams eliminated from playoff contention may rest starters and lose motivation, while teams fighting for positioning play at maximum effort. The market accounts for obvious situations but sometimes misses subtle roster management decisions.
Putting It All Together: Sample Matchup Breakdown
Successful matchup analysis combines all factors discussed into coherent game projections. Rather than looking at any single element in isolation, you’re weighing everything based on its predictive importance for the specific game.
The process starts with starting pitchers, the highest-impact factor in most games. Evaluate each starter using FIP, xFIP, and recent form. Consider the opposing lineup’s platoon splits against the pitcher’s handedness. Note any recent workload concerns that might affect performance.
Next, assess bullpen availability for both teams. If the game projects as close, bullpen quality becomes more important. Check recent usage for key relievers, especially in high-leverage roles. A team with fresh arms holds advantages over one running thin after consecutive extra-inning games.
Factor in environmental conditions — ballpark effects, weather forecasts, and umpire assignments. These elements primarily affect totals projections but can also influence side bets when extreme conditions exist.
Finally, consider schedule context. Travel situations, day-night sequences, and emotional dynamics add final adjustments to your baseline projection.
The output should be a win probability for each team and an expected total runs figure. Compare these projections against available betting lines to identify value. When your projection differs significantly from the market, investigate why — either you’ve found an edge or you’re missing something important.
Building Your Matchup Analysis Process
Developing consistent matchup analysis requires building habits and systems. Create a routine for gathering information each day: check pitcher matchups, monitor lineup news, review weather forecasts, and note umpire assignments. Do this before looking at betting lines to avoid anchoring bias.
Track your projections against actual outcomes to identify strengths and weaknesses in your process. Maybe your pitcher analysis is sharp but your weather adjustments need refinement. The data reveals where to focus improvement efforts over time.
Matchup analysis becomes faster with practice. What takes an hour per game initially compresses to fifteen minutes once you know where to look and what matters most. The goal isn’t analyzing every game perfectly — it’s identifying the handful of daily games where your analysis reveals betting value others miss.
Written by the editors at mlb Bets.